
Why methodology matters in fibre micron testing.
Why methodology matters?
Imagine spending thousands of dollars of a piece of technology that helps you measure samples within 1/1000 of a millimetre, i.e. 1 micron (um) only to have it report seemingly random numbers every time you use it. Most would be quick to assume that the system is faulty and not able to measure well, and in some cases that would be true. But often, it comes down to how the equipment is used, methodology matters. It pays to be well informed.
With any technology built to measure micron, the method adopted by the user can impact the precision, repeatability and reliability of micron results. Sound methodology resulting in accurate testing, supports informed breeding, fleece selection, marketing and management decisions, leading to better profits. Poor methodology can lead to inaccurate results, risking misclassification and lost value.
For these reasons, it is important to understand how the methodology affects the outcomes of the results and to ensure best practice is adopted for optimum data.
Why test wool?
With approximately 70-80% of the value of wool (tops) attributed to micron, measuring fleece quality helps producers select breeding stock for genetic improvement and animal resilience, prepare and class clip for premium pricing opportunities.
Taken together with staple length, strength, colour, yield, comfort factor, vegetable matter and overall fleece weight, it allows brokers and buyers to price wool accurately and better compete for well-specified clips.
It is now becoming expected to report objective data in the auction system, so tested wool attracts more buyer confidence and can capture premiums where quality is above average. Annual testing makes it easier to identify both high-performing bloodlines and individual animals and make selection decisions based on actual fleece data, not just visual classing.
It also reduces the producer’s risk of maintaining animals with micron blow-out which can affect the profitability of the flock at sale time.
Not all staples are created equal – why are mid-samples often used?
The average diameter of wool fibres (Mean Fibre Diameter: MFD) can vary either along the fibre or staple (termed Fibre Diameter Profile), throughout the staple (determined by the primary to secondary fibre type ratios), throughout the fleece and between animals within a mob.
Various instruments used both on-farm or in testing houses can measure different aspects of the above-mentioned fibre diameter profiles, depending on how the sample is prepared and measured. To simplify the testing process and to allow a higher throughput of samples (particularly on-farm, where a high processing time leads to higher labour costs), the mid-side is used as a standardised point of sample selection as it has been determined to be representative of the animal fleece average [Ref 1].
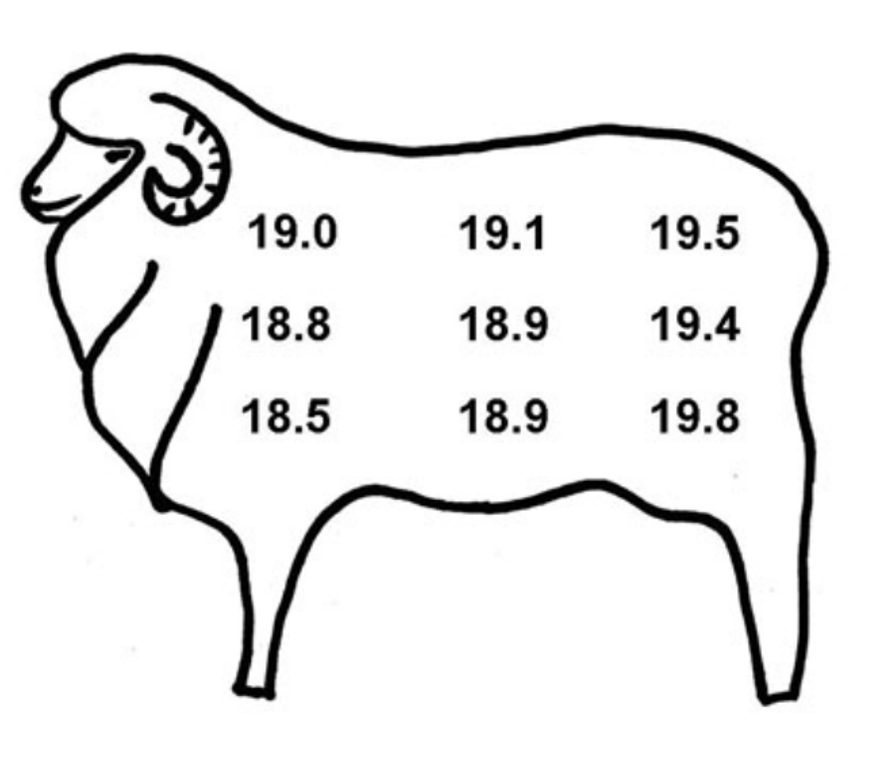
Fig. 1: The pattern in the variation of diameter over a Merino fleece (V. Fish, 2002)
Testing from a single point across animals, helps standardise and compare results across flocks and breeds and reduce bias from sampling location, ensuring accurate typing for sale and breeding. This further highlights the importance of applying a standard methodology when measuring.
Current testing methods – what do they tell you and how?
The type of testing method used for measuring the average micron or MFD of a sample, is often determined by what the results are being used for as well as time and cost considerations of the producer.
For example, testing that requires an IWTO [Ref 2] ‘certificate of sale’ must be done in accordance with IWTO standards in an approved testing house. These tests generally are done on core samples taken from bales that are washed and cut into snippets (2 mm long fibre sections) before being measured. This can be done on either laser-based (Lasercan) or image-based (OFDA100) systems that have been calibrated according to IWTO standards.
Samples taken from individual animals for either sale data or clip preparation, can be measured either on-farm or in a testing house using similar equipment (Laserscan or OFDA2000). While many producers tend to use samples collected from the mid-side (or pin-bone to a lesser extent), others prefer to core-sample the whole fleece (using Fleecescan: On-farm modified Laserscan) at shearing time, for a better representative average.
Unlike the Laserscan and OFDA100 which were designed to be used with snippet samples, newer equipment was designed to allow for intact staple measurements to reduce processing time with the added benefit of being able to measure along the length of the fibre to view the entire micron profile.
Independent of the sample type and preparations used, all the equipment listed in Table 1 below are designed to report on the average micron of the sample, along with statistics such as standard deviation, co-efficient of variance and comfort factor.
It is worth noting that regardless of which instrument is used, sample selection, preparation and presentation will influence the data outcomes. Furthermore, due to the irregular shape of wool fibres it is fairly well understood the average fibre diameter measurements made using different testing modalities, may give slightly different results in some cases.
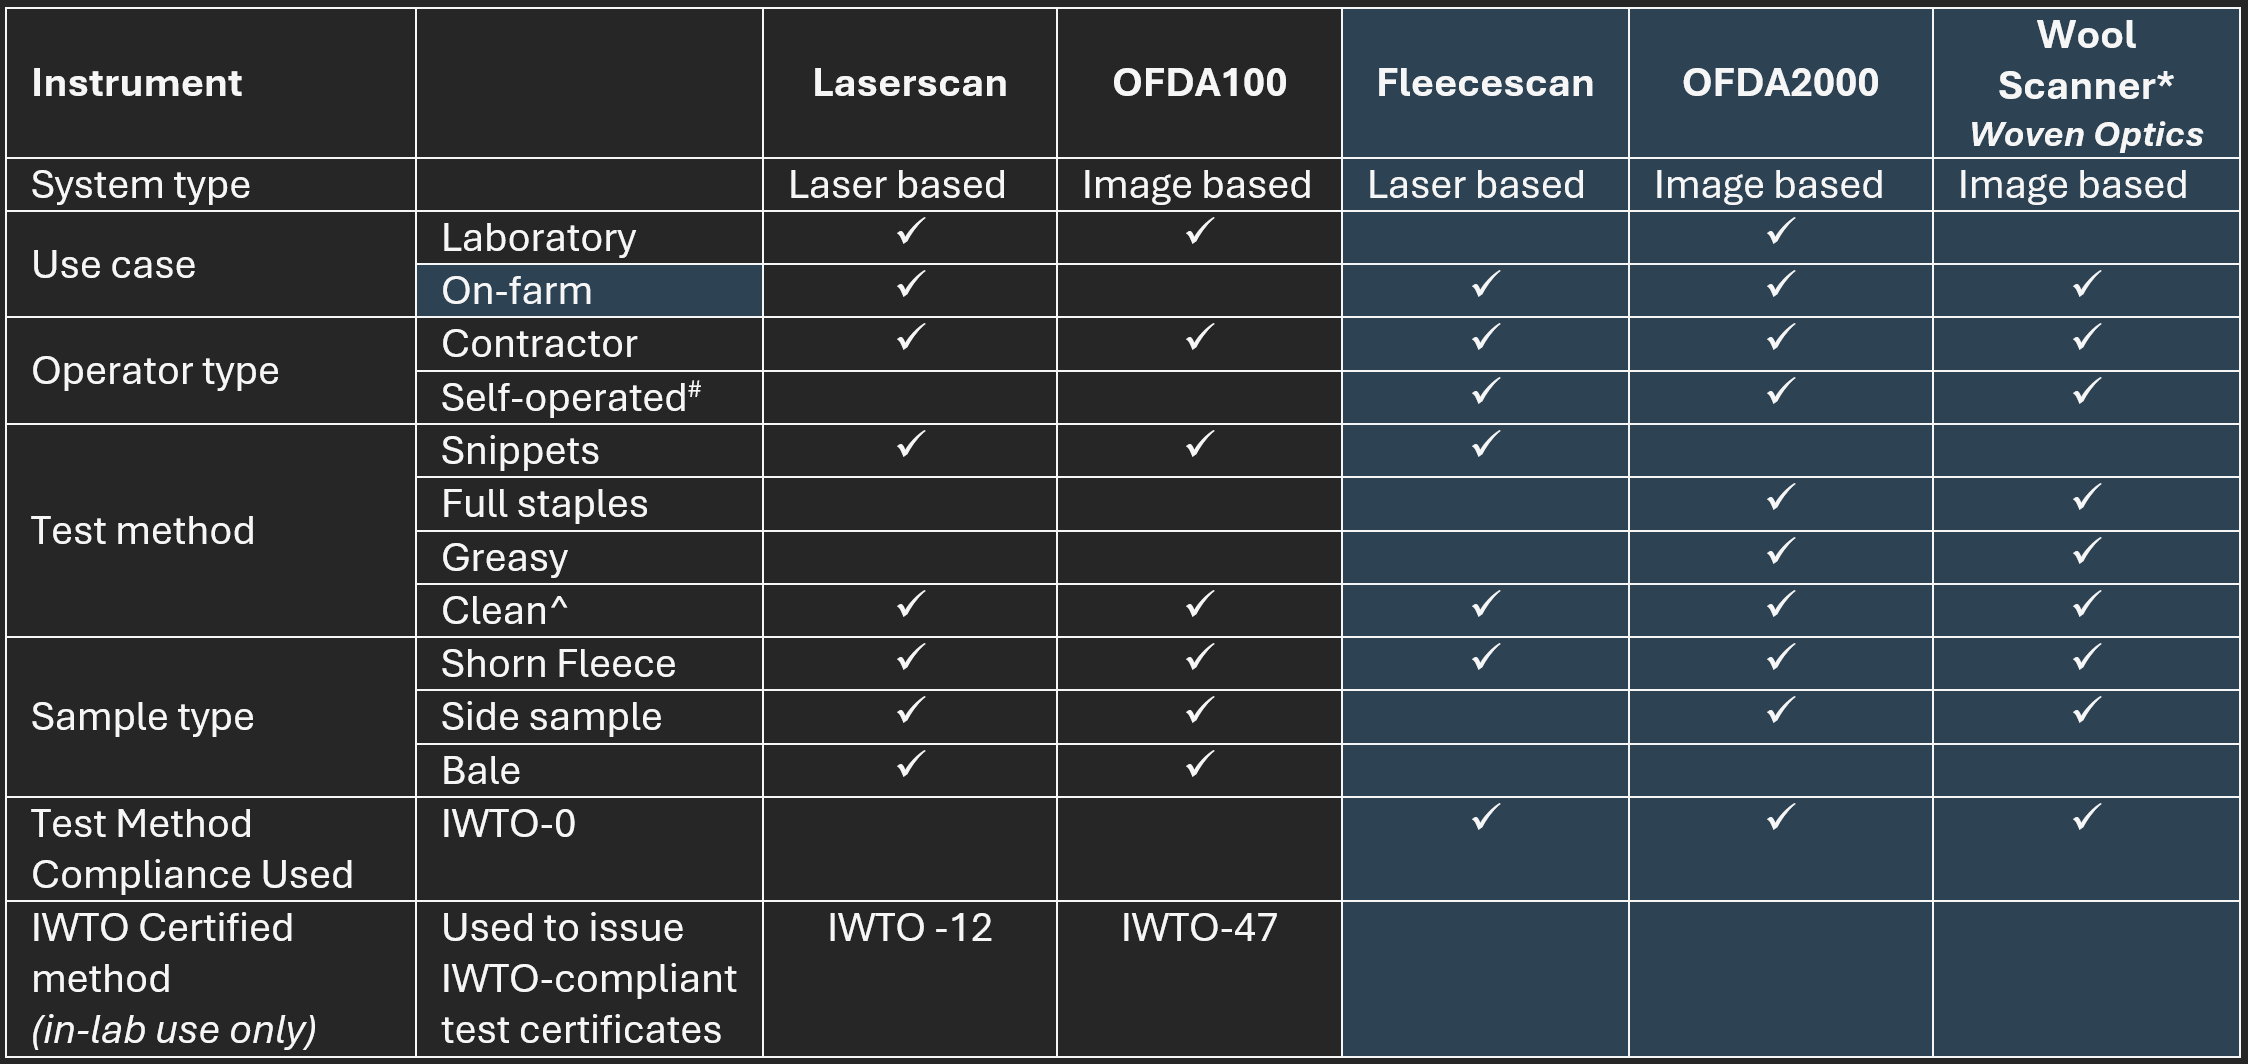
Table 1: Comparison of most the frequently used micron testing equipment.
#Generally, Laserscan, Fleecescan, OFDA100 & OFDA2000 are managed by trained contractor/operators.
^Cleaned using either a water/isopropanol or water/detergent solution to remove grease from fibre sample.
Where does Woven Optics fit in and how does it compare?
Unlike the equipment that was designed to be used in a testing house or by trained contractors, the Woven Optics Wool Scanner (Fig 2.) was designed with the producer in mind. This hand-held ‘microscope’ is designed to provide portable, fast and accurate on-farm micron measurements that are linked directly to individual animals.
It allows for real-time data capture at shearing time or selection points throughout the breeding cycle, as well as record keeping for later analysis and integrates well into existing farm management systems.
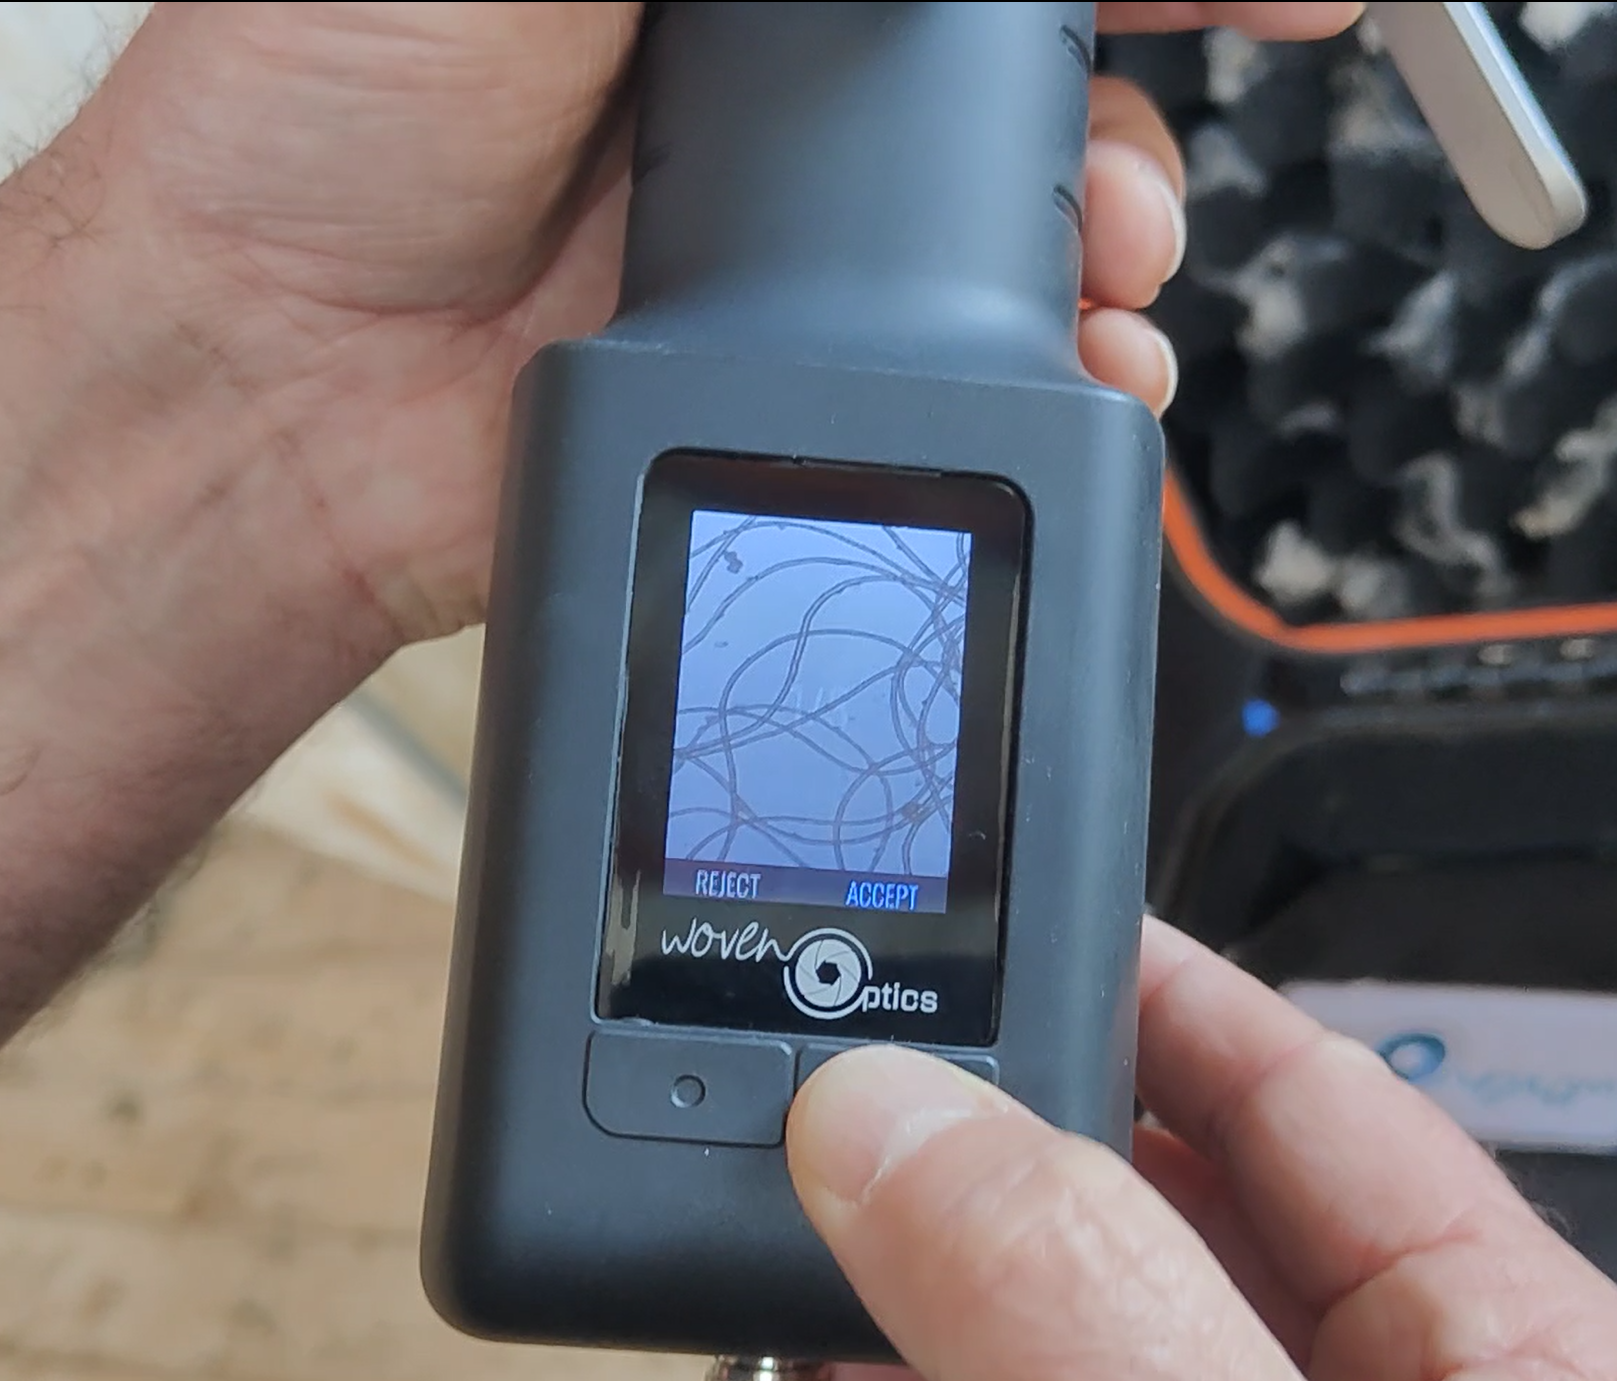
Figure 2. Example of wool fibres captured on the Woven Optics Wool Scanner handheld unit.
This image-based technology has been tested using methods outlined in the IWTO-0 guidelines [Ref 3]. The Woven Optics Wool Scanner system has been shown to predict the results of the calibration samples (range tested: 14 – 35 um) with an R2 value of 0.996 (a value close to 1 indicates a high probability of reading the same results). When compared to Laserscan measurement, the Woven Optics Wool Scanner system can predict the results of the same calibration samples with an R2 value of 0.995. Therefore, demonstrating that is well correlated with industry standard methods, enabling confident decision-making.
This system provides mean fibre diameter statistical data by measuring fibres along the staple. It requires less sample than traditional methods (when testing mid-side samples) but also has the capacity to capture more samples throughout the fleece, making it versatile for the producer.
How to get the most out of portable testing using Woven Optics.
The Wool Scanner allows producers to integrate testing into routine shearing, classing, and selection workflows and their technical team helps train staff to ensure consistent sampling and efficient data collection.
Samples can be tested greasy or clean and most lengths can be assessed, although it is recommended to use staples 100 mm and above for optimal results. Test at shearing, when selecting ewe hoggets for breeding or ram lambs for studs. This equipment allows producers to test often and optimise the flock by identifying outlier animals early.
Test fibres ranging from 10 – 50 um simply by adjusting the number of images captured along the staple (< 23 um: 3 images, > 23 um: 5+ images recommended for optimal results) and if required, simply test the sample again to check the result and ensure you have captured the right number of fibres.
The Woven Optics Wool Scanner can also measure micron data of other fibre types such as Alpaca and Angora. More information about the studies carried out on these fibre types will made be available soon.
The eID scanner allows for immediate linking of data to individual animals, as well as lifetime tracking. Export data into a simple csv file for easy integration and assess your images anytime to ensure optimal data collection.
Finally, it is important to follow best practice when using the portable Wool Scanner to build it into normal shearing and classing workflows, by using consistent sampling methods (staples ≥ 100 mm where possible), the recommended number of images for different micron ranges, and repeat tests where needed so results reliably reflect each animal and line. Linking scans to eID and exporting data for lifetime tracking then turns those accurate, repeatable measurements into powerful flock R&D, helping identify outliers early and refine breeding and management decisions over time.
References
1. Fish, V.E. 2002, ‘The Morphometry and Measurement of Wool Fibre Curvature, and Its Variation in Commercial Fleece and Sale Lot Testing,’ MRuSc Thesis, UNE.
2. IWTO Test Methods, various test methods, International Wool Textile Organisation.
3. Alexandrou, V. 2024, ‘A New Optical Device for On-farm Testing of Fibre Diameter.’, Report to the Wool Innovation & Technology Forum, IWTO, Adelaide.